
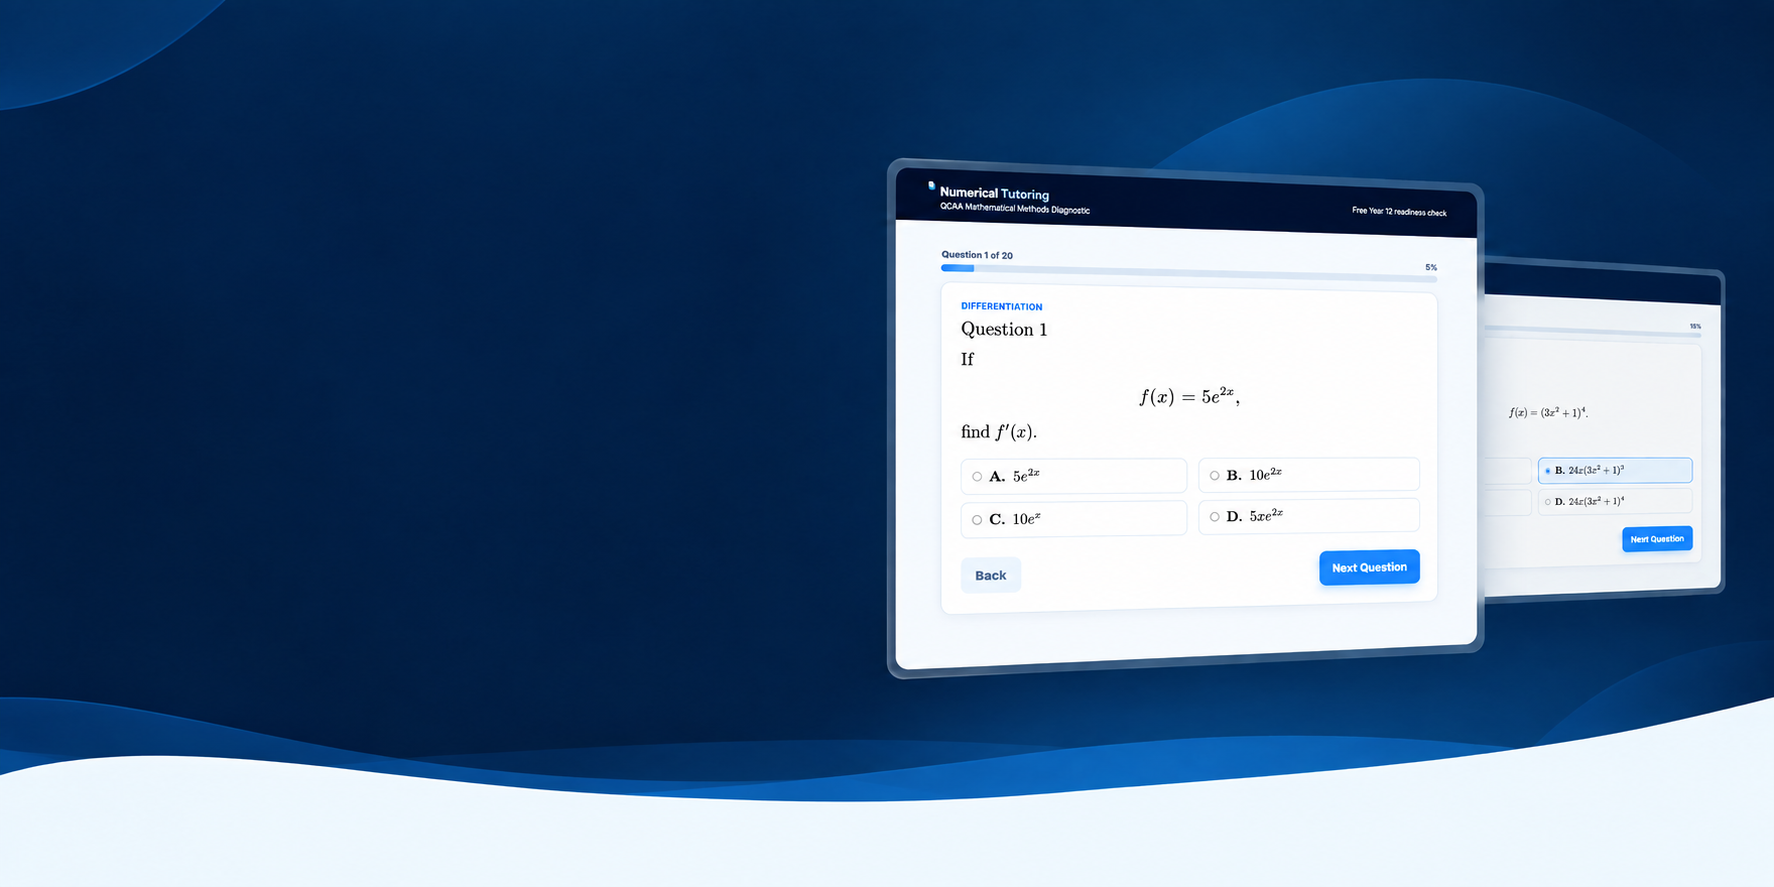
Find Out Exactly

What You Need to Revise

Take a free QCAA Mathematical Methods diagnostic and discover your strengths, weaknesses and the topics you should focus on next

Blue circular icon with a white open book symbol in the center.

Free No sign-up cost

Blue circular button with glowing white bar graph icon featuring three vertical bars of varying heights.

Instant Results, See your strengths and weaknesses

Neon blue clock icon with white clock face showing 3:00, glowing against a black background.

Takes around 10 minutes, carefully selected QCAA questions

Choose a Diagnostic

Select a Diagnostic

to Get Started

Each diagnostic has 12 QCAA style questions and takes around 10 minutes to complete
Blue promotional banner advertising a full year 12 methods diagnostic test. Includes an icon with a bar chart, with text highlighting comprehensive coverage of major topics for a full overview of current level.
A quiz cover about surds and quadratics featuring a blue square root icon, the title "Surds & Quadratics" in bold, and text describing the quiz as testing skills with surds, indices, quadratic equations, and inequalities, with 12 questions and approximately 10 minutes to complete.
Educational graphic about differentiation in calculus, featuring the derivative notation d/dx, with text explaining test differentiation rules, stationary points, tangents, rates of change, and optimization, along with a clock icon, indicating 12 questions and approximately 10 minutes.
A flyer promoting a probability test, featuring a blue bar chart icon, the word 'Probability' in bold, and details about the test including 12 questions and approximately 10 minutes to complete.
Educational poster titled 'Polynomials & Cubics' with a cube icon, encouraging understanding of polynomials, the remainder theorem, factor theorem, and cubic functions, displaying 12 questions and approximately 10 minutes.
A study guide cover titled 'Integration,' with instructions to check understanding of indefinite and definite integration, u-substitution, and applications. Includes a clock icon, mentioning 12 questions and approximately 10 minutes.
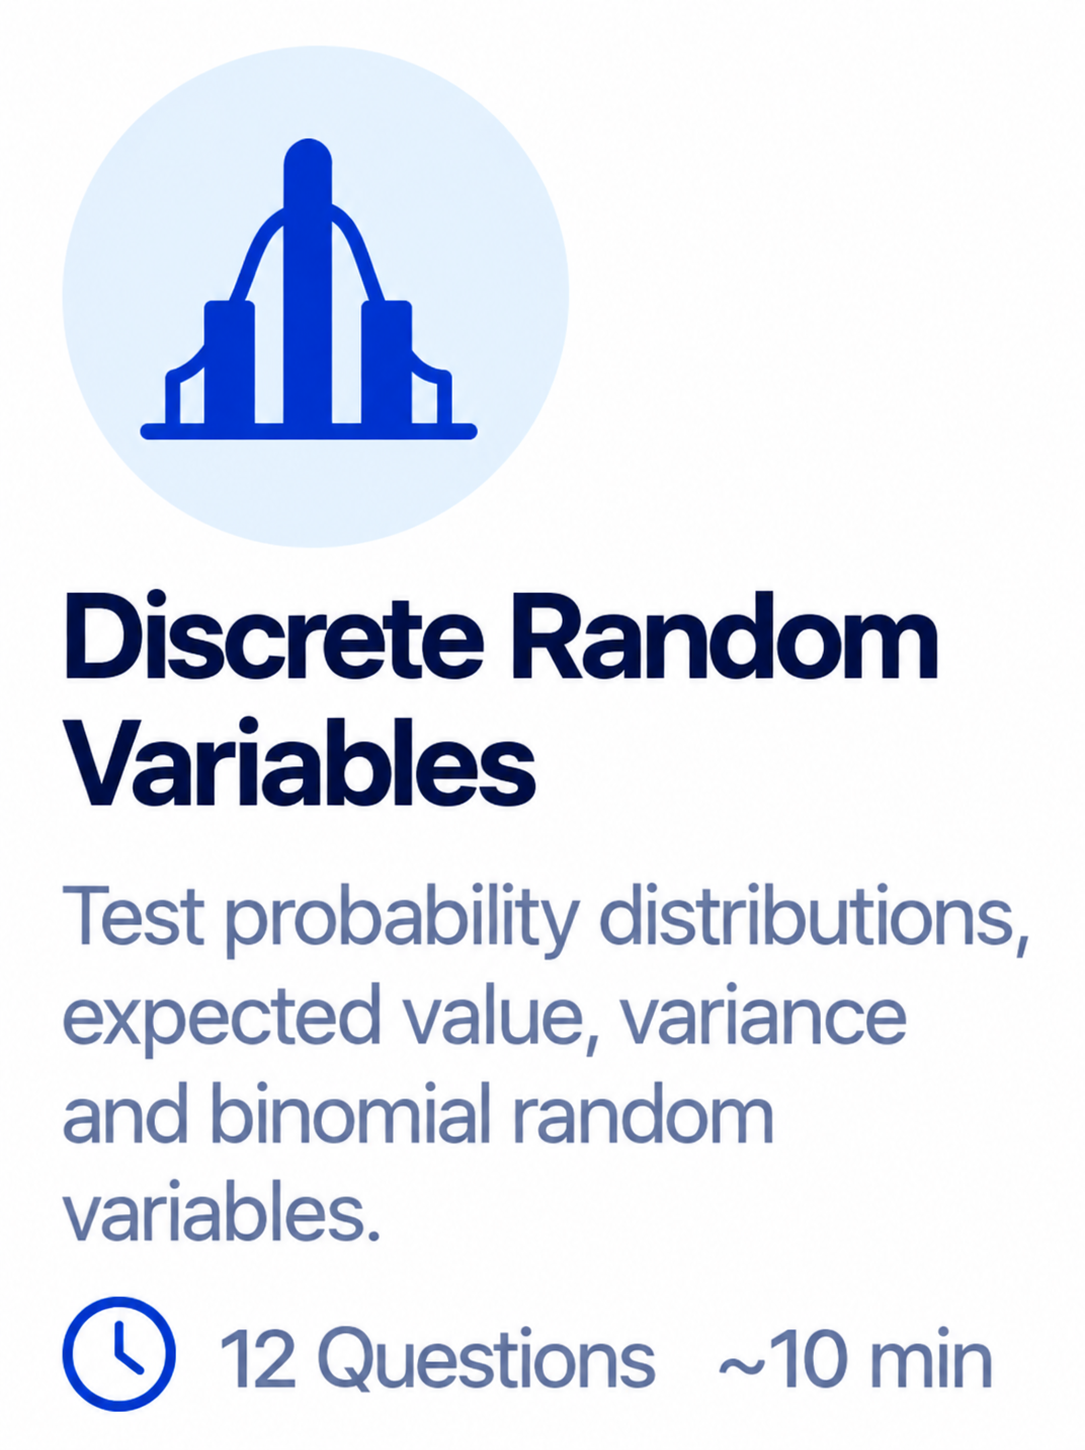
Cover slide for a presentation on Discrete Random Variables, featuring a blue icon of a bar graph with a curved line, and text about test probability distributions, expected value, variance, and binomial random variables, including a clock icon indicating 12 questions in about 10 minutes.
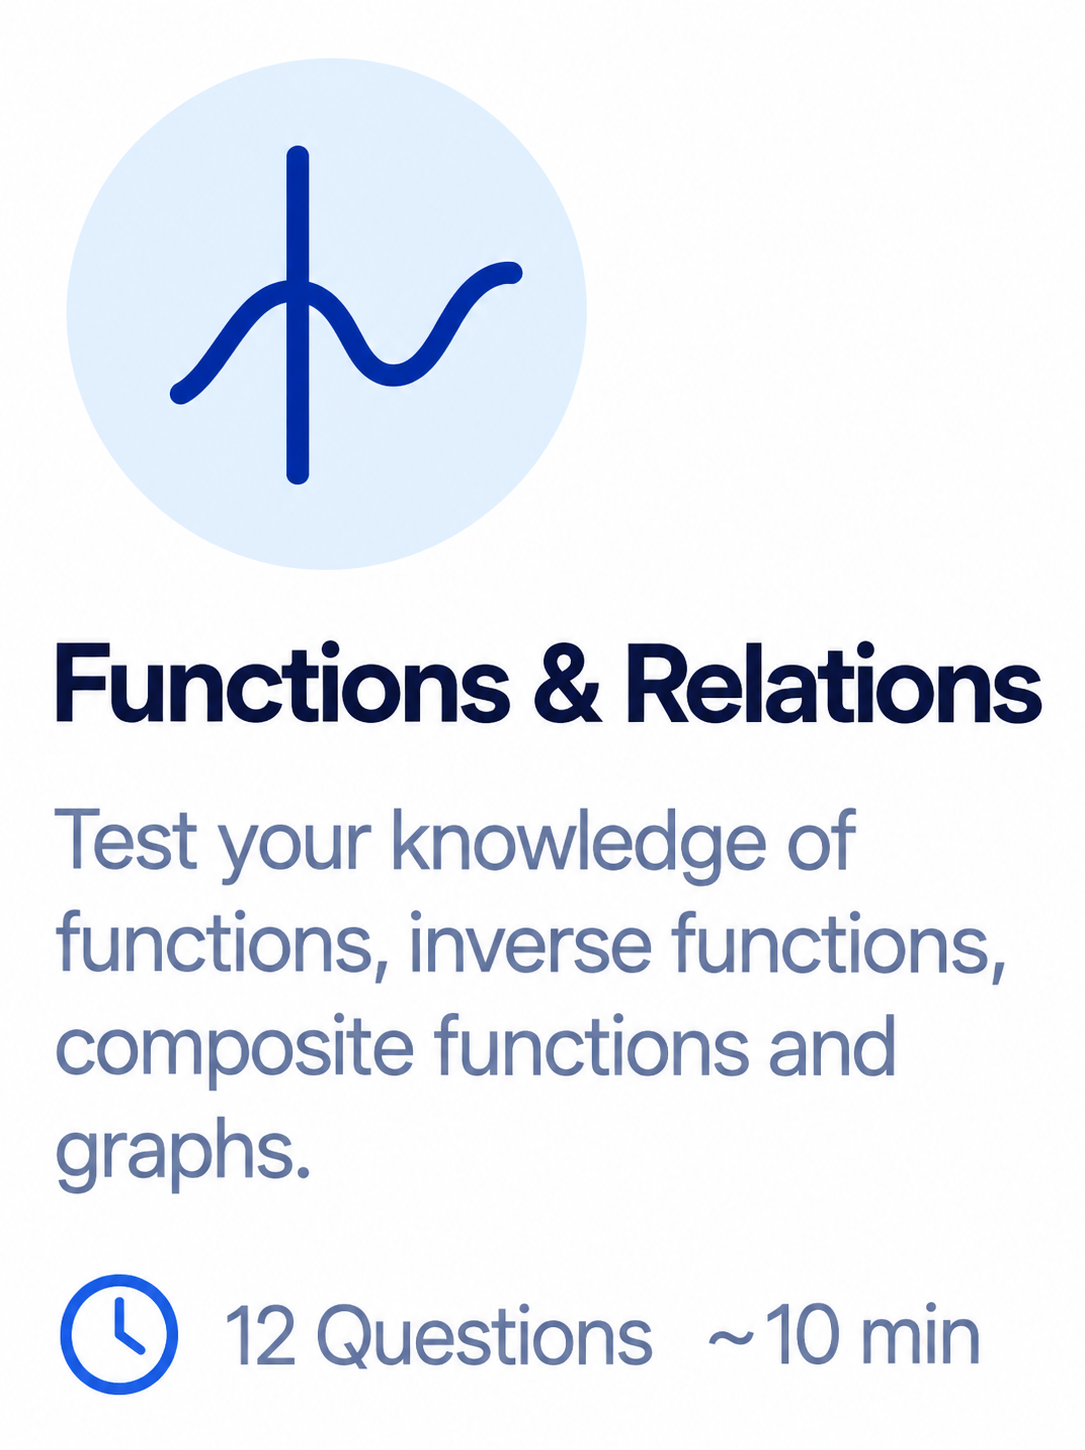
Digital quiz cover titled 'Functions & Relations' with a graph icon, describing a test of knowledge on functions, inverse functions, composite functions, and graphs, with 12 questions and estimated 10-minute duration.
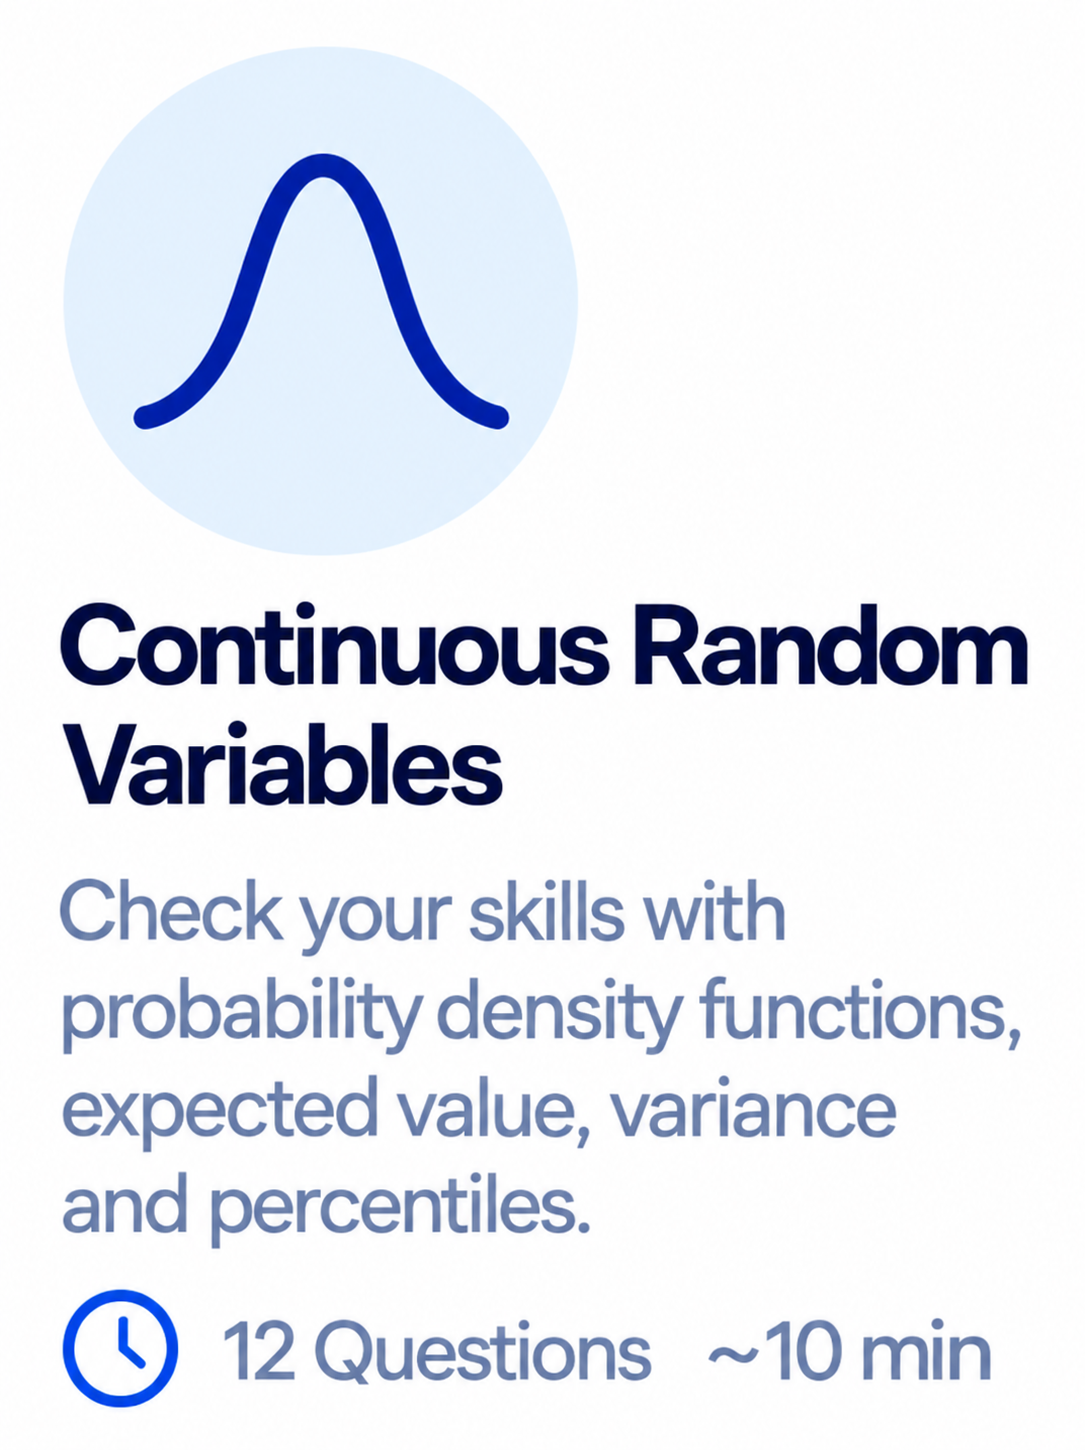
Text and icon about continuous random variables, including a bell curve icon, and information about a quiz with 12 questions and an estimated 10-minute completion time.
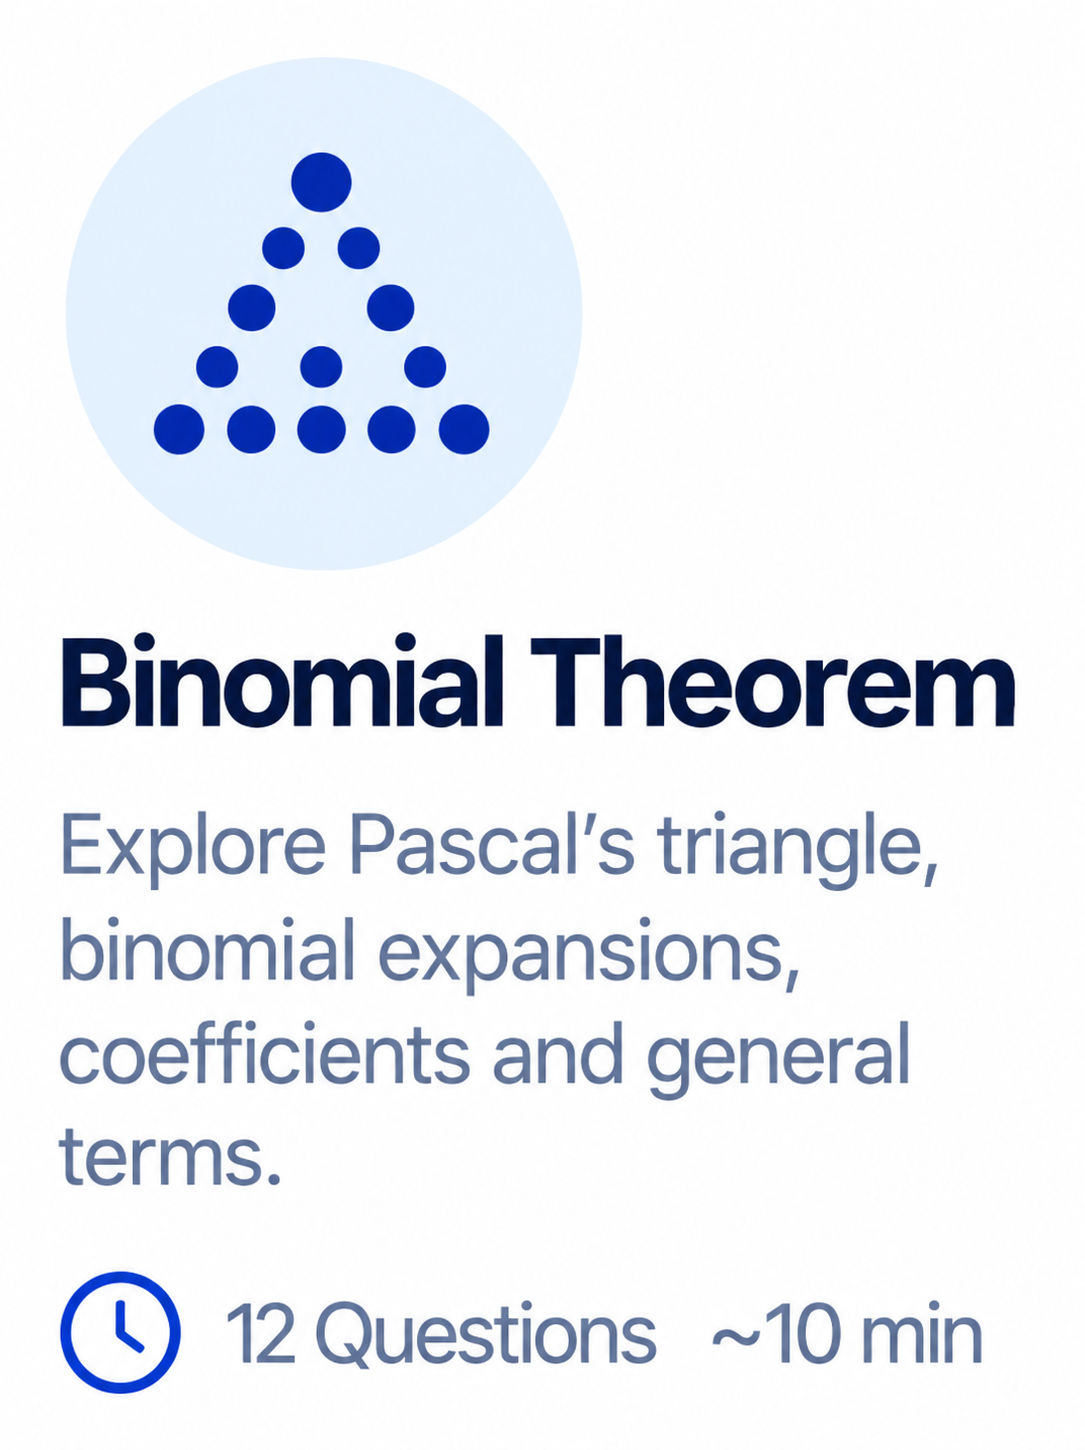
Logo for Binomial Theorem with an abstract icon of a Pascal's triangle made of blue dots, and text promoting exploring Pascal's triangle, binomial expansions, coefficients, and general terms, with a clock icon indicating 12 questions and approximately 10 minutes.
Poster explaining the normal distribution with a bell curve, titled 'Normal Distribution,' including details about testing models, standardization, probabilities, and approximation to binomial distribution, along with a clock icon indicating 12 questions and a duration of approximately 10 minutes.
A digital flashcard with a symbol of a triangle inside a circle, and the word 'Trigonometry' in bold, followed by the text 'Test your understanding of trigonometric functions, identities, equations and applications.' There is a clock icon indicating 12 questions and an estimated time of about 10 minutes.
Information screen about sampling and confidence intervals with an icon of a clipboard, explaining exploring sample proportions, confidence intervals, and sample distribution, including a quiz of 12 questions and estimated time of 10 minutes.
Promotion for a skills assessment on exponentials and logarithms with a logo, title, description, and icons indicating 12 questions and approximately 10 minutes.

Get a clear breakdown

of your strengths

and areas to improve

Once you complete a diagnostic, you'll instantly receive a detailed report showing how you performed, the topics you're strong in, and the areas to focus on

Overall Score

See your total score and how you performed across all topics

Icon of a blue bar chart with three vertical bars increasing in height from left to right.
Icon of a document with lines of text and a folded corner, in blue on a light blue circular background.

Topic Break

View your score for each topic to identify strengths and weaknesses

Personalised feedback

Get tailored feedback and recommendations on what to focus on next

Icon of a target with an arrow hitting the bullseye, symbolizing goal achievement or precision.
A circular icon with a blue line graph showing an upward trend on a light blue background.

Next Steps

Use your results to create a clear study plan and track your progress over time
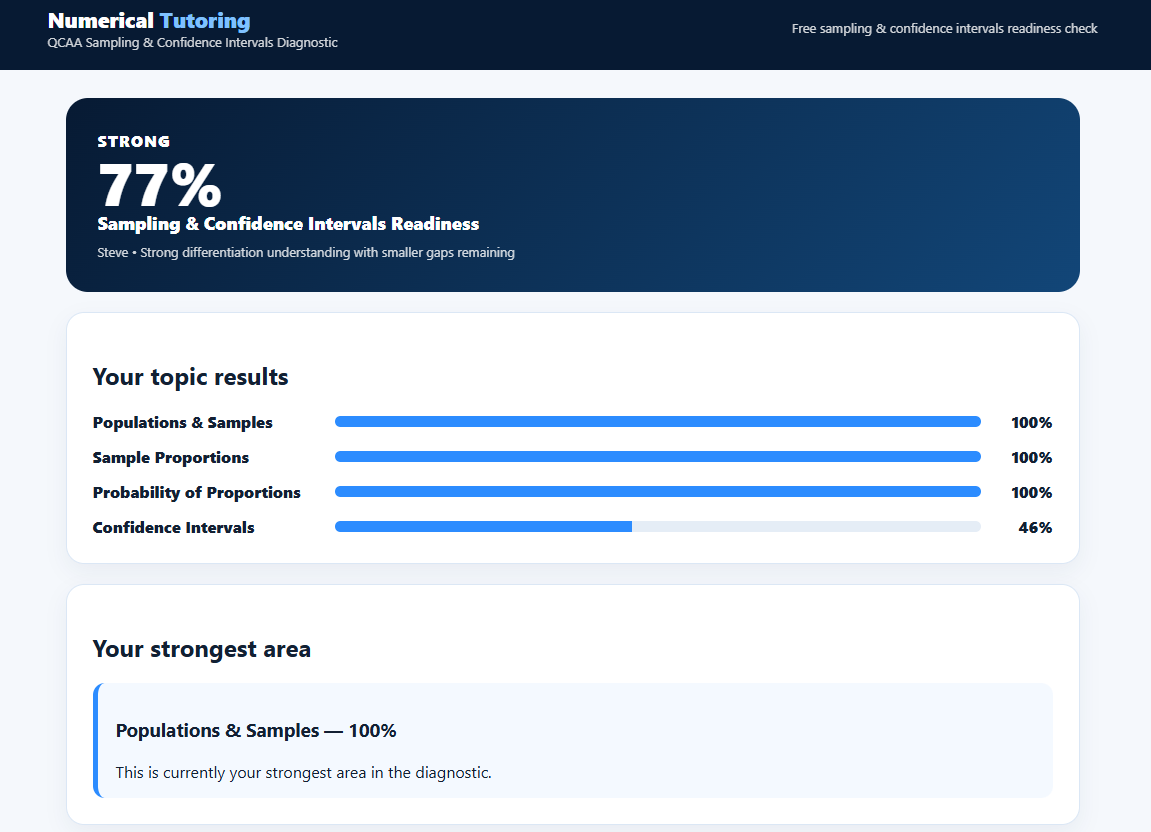
Screenshot of a statistical analysis report showing 77% being strong in sampling and confidence intervals readiness, with results indicating 100% in populations & samples, sample proportions, and probability of proportions, and 46% confidence intervals. The report includes sections titled 'Your topic results' and 'Your strongest area'.
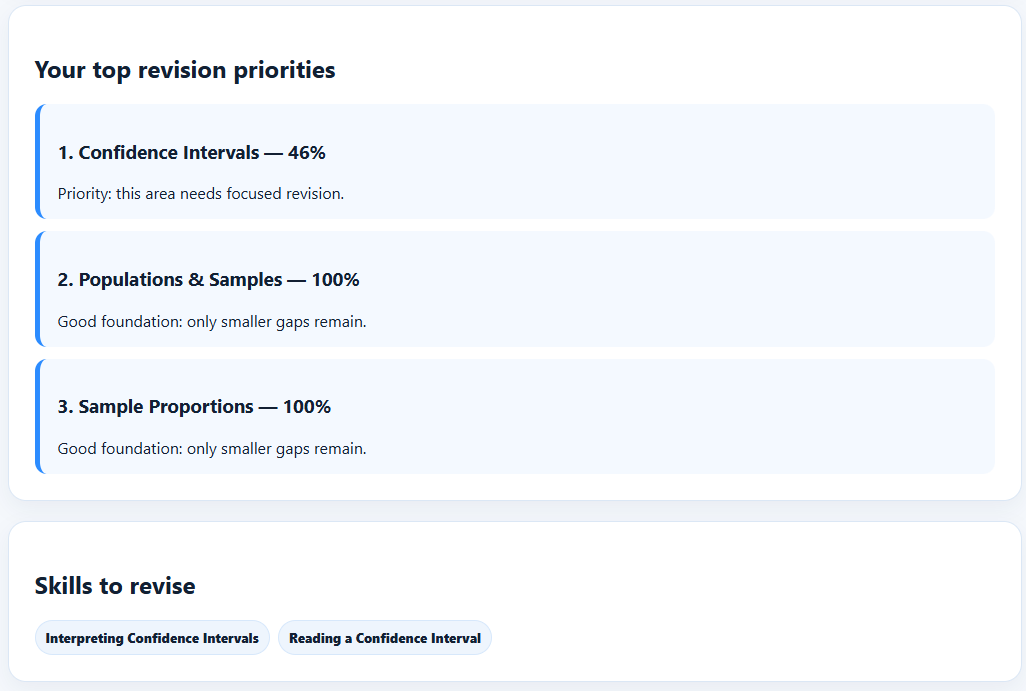
A screenshot of a web page showing top revision priorities with confidence intervals, populations & samples, and sample proportions, along with skills to revise related to interpreting and reading confidence intervals.